Let your agents profile AI agents like programs.
System-level profiling/tracing tools and skills for Claude Code, Codex, and other local agents. Understand where time, tokens, commands, files, network calls, and system resources go, without SDKs.
$ cargo install agentsight
$ sudo agentsight record -- claude
$ agentsight report export -o snapshot.json
One run profile for the parts normal LLM traces miss.
Application traces are useful when you own the agent code. AgentSight focuses on the system boundary: the child processes, file operations, network destinations, resources, and model traffic that shape the actual run.
Time
LLM, shell, and wait time
Tokens
Turns, models, and loops
Commands
Exec tree and exit status
Files
Reads, writes, deletes
Network
Endpoints and processes
Resources
CPU, memory, sessions
Traditional observability cannot parse what an agent was trying to do.
AI agents execute unpredictable actions that break the assumptions of static dashboards. The hard problem is not collecting more telemetry. The hard problem is connecting natural language intent to low-level OS side effects.
Observer-agent workflow
AgentSight gives an independent observer agent the system-level tools and skills it needs to correlate prompts, model calls, commands, files, network, and resources. The output is not just a raw trace; it is a causally linked run profile, report, or Agent Flamegraph that explains where the run went.
Built for runs that are slow, expensive, risky, or hard to review.
The best first use is not another dashboard. It is a profile you can open after a real agent run and use to answer why the run was costly, where it stalled, or what happened around a failure.
Profile slow or expensive agent runs
Break down a run by LLM time, shell time, repeated file scans, network waits, token loops, CPU, and memory.
Review AI-generated PRs faster
Attach a run profile with commands, tests, retries, files touched, network calls, and resource cost.
Trace closed-source agent CLIs
Monitor Claude Code, Codex, Gemini CLI, OpenCode, OpenClaw, and local commands without vendor hooks.
Generate shareable insight pages
Use AgentSight skills to drive profiling workflows and turn traces into findings, tables, and single-file HTML reports.
Audit MCP servers, skills, and plugins
Run tools under system-level tracing to see file writes, child processes, external calls, and token impact.
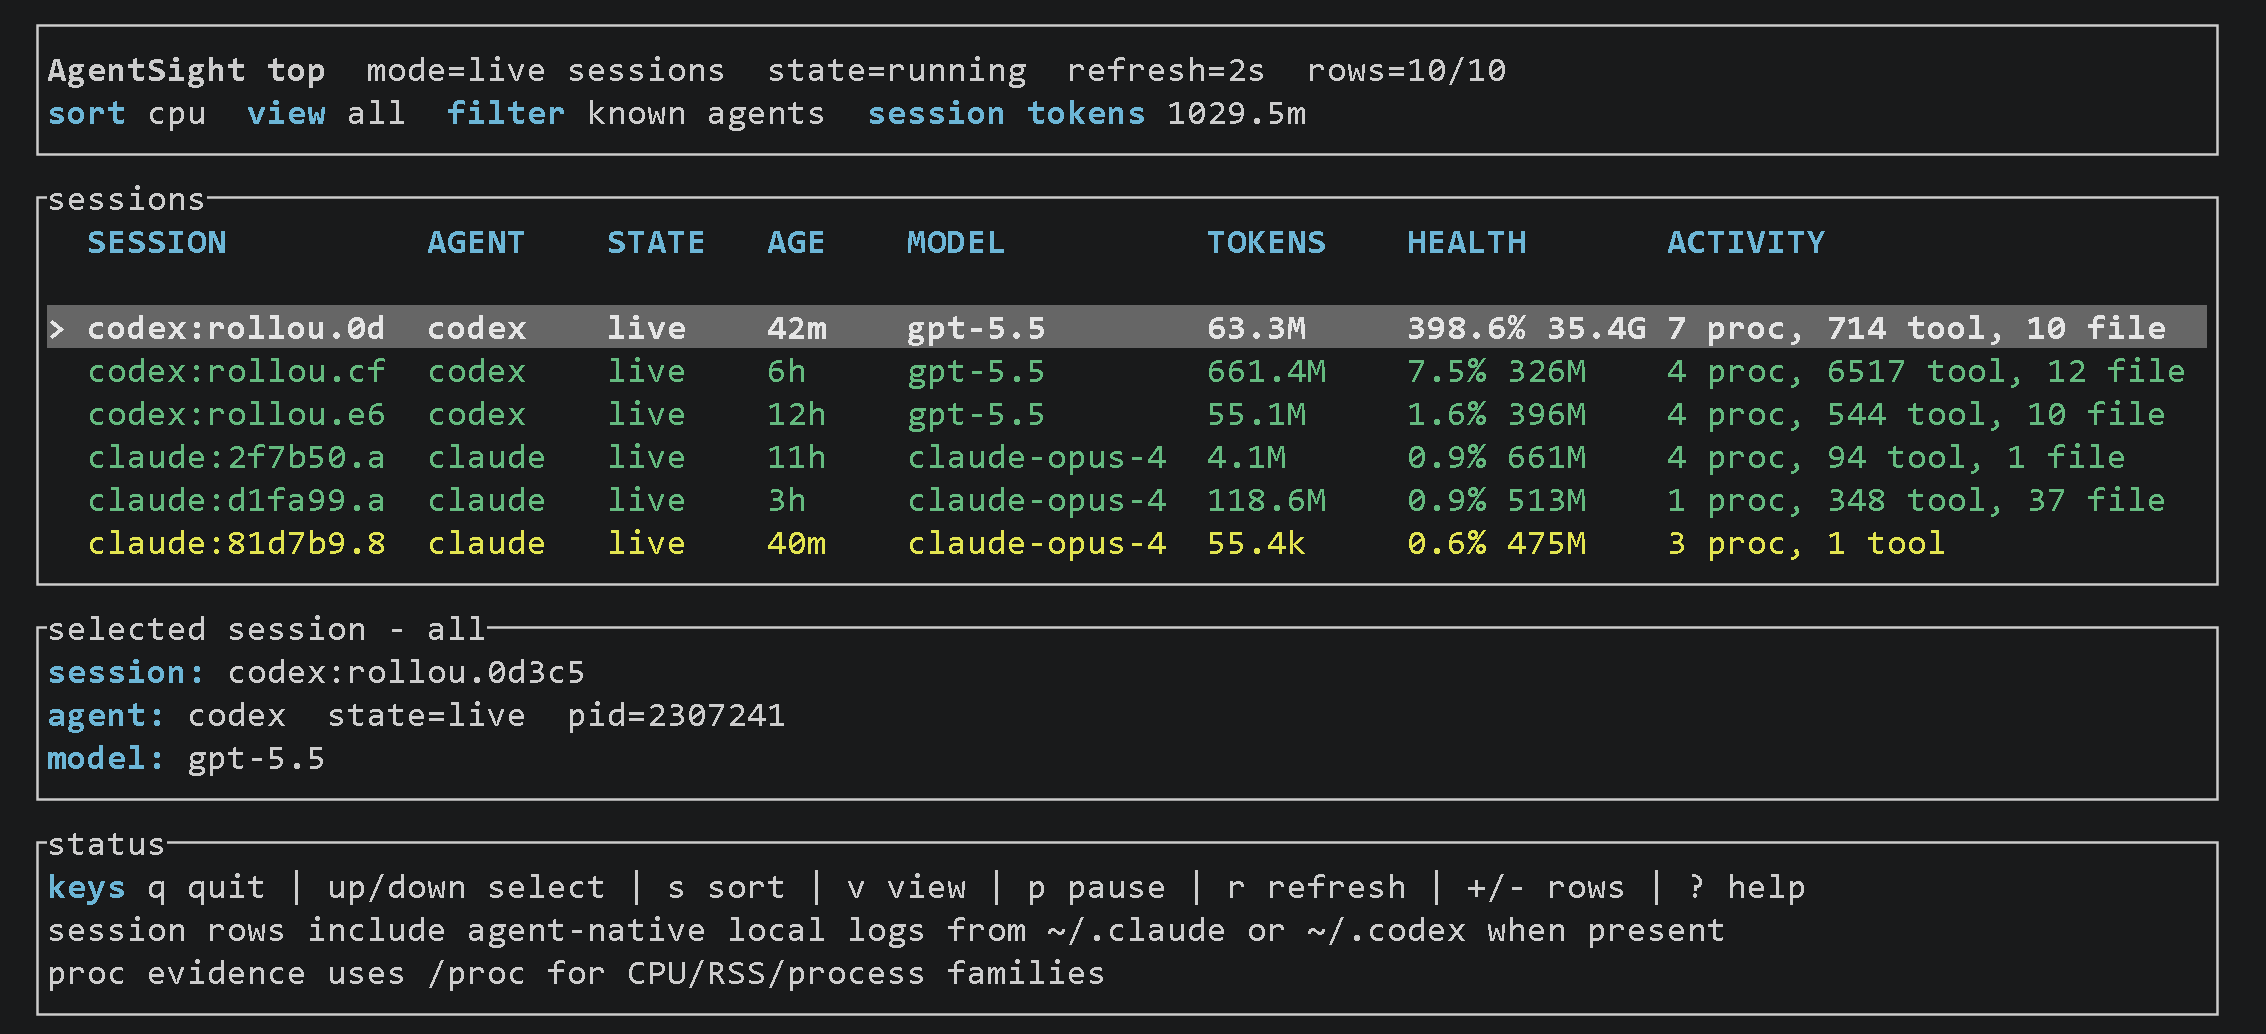
Turn a long agent session into a compact profile.
Use AgentSight during a coding run, then inspect a saved SQLite session, live UI, or exported snapshot. The product page links to the app demo; the reference docs stay on Eunomia.
Skills are the control surface, not the afterthought.
AgentSight is designed so agents can drive profiling work themselves. Skills tell the agent which profiling tools to run, which evidence to collect, which metrics to rank, what to redact, and how to turn the trace into a useful artifact. The eBPF tools and the skills are co-equal parts of the product.
Choose the profiling skill
The skill tells the agent what to measure, which tools to call, and what evidence matters for the task.
Run system-level tools
The eBPF profiler captures model calls, process tree, files, network, and resource samples from the agent run.
Create the artifact
The skill guides the agent from raw trace data to a self-contained report for review, audit, or debugging.
Start with a recorded run.
Use the app demo, then run AgentSight around a local agent when you are ready to profile your own workflow.